
See Your Dashboard Before You Buy
Explore every screen of the Presgraphics Analytics dashboard. Real data, real insights, real results — this is exactly what you get on day one.
Click any screenshot to view it in full size
Screenshot 1 of 11
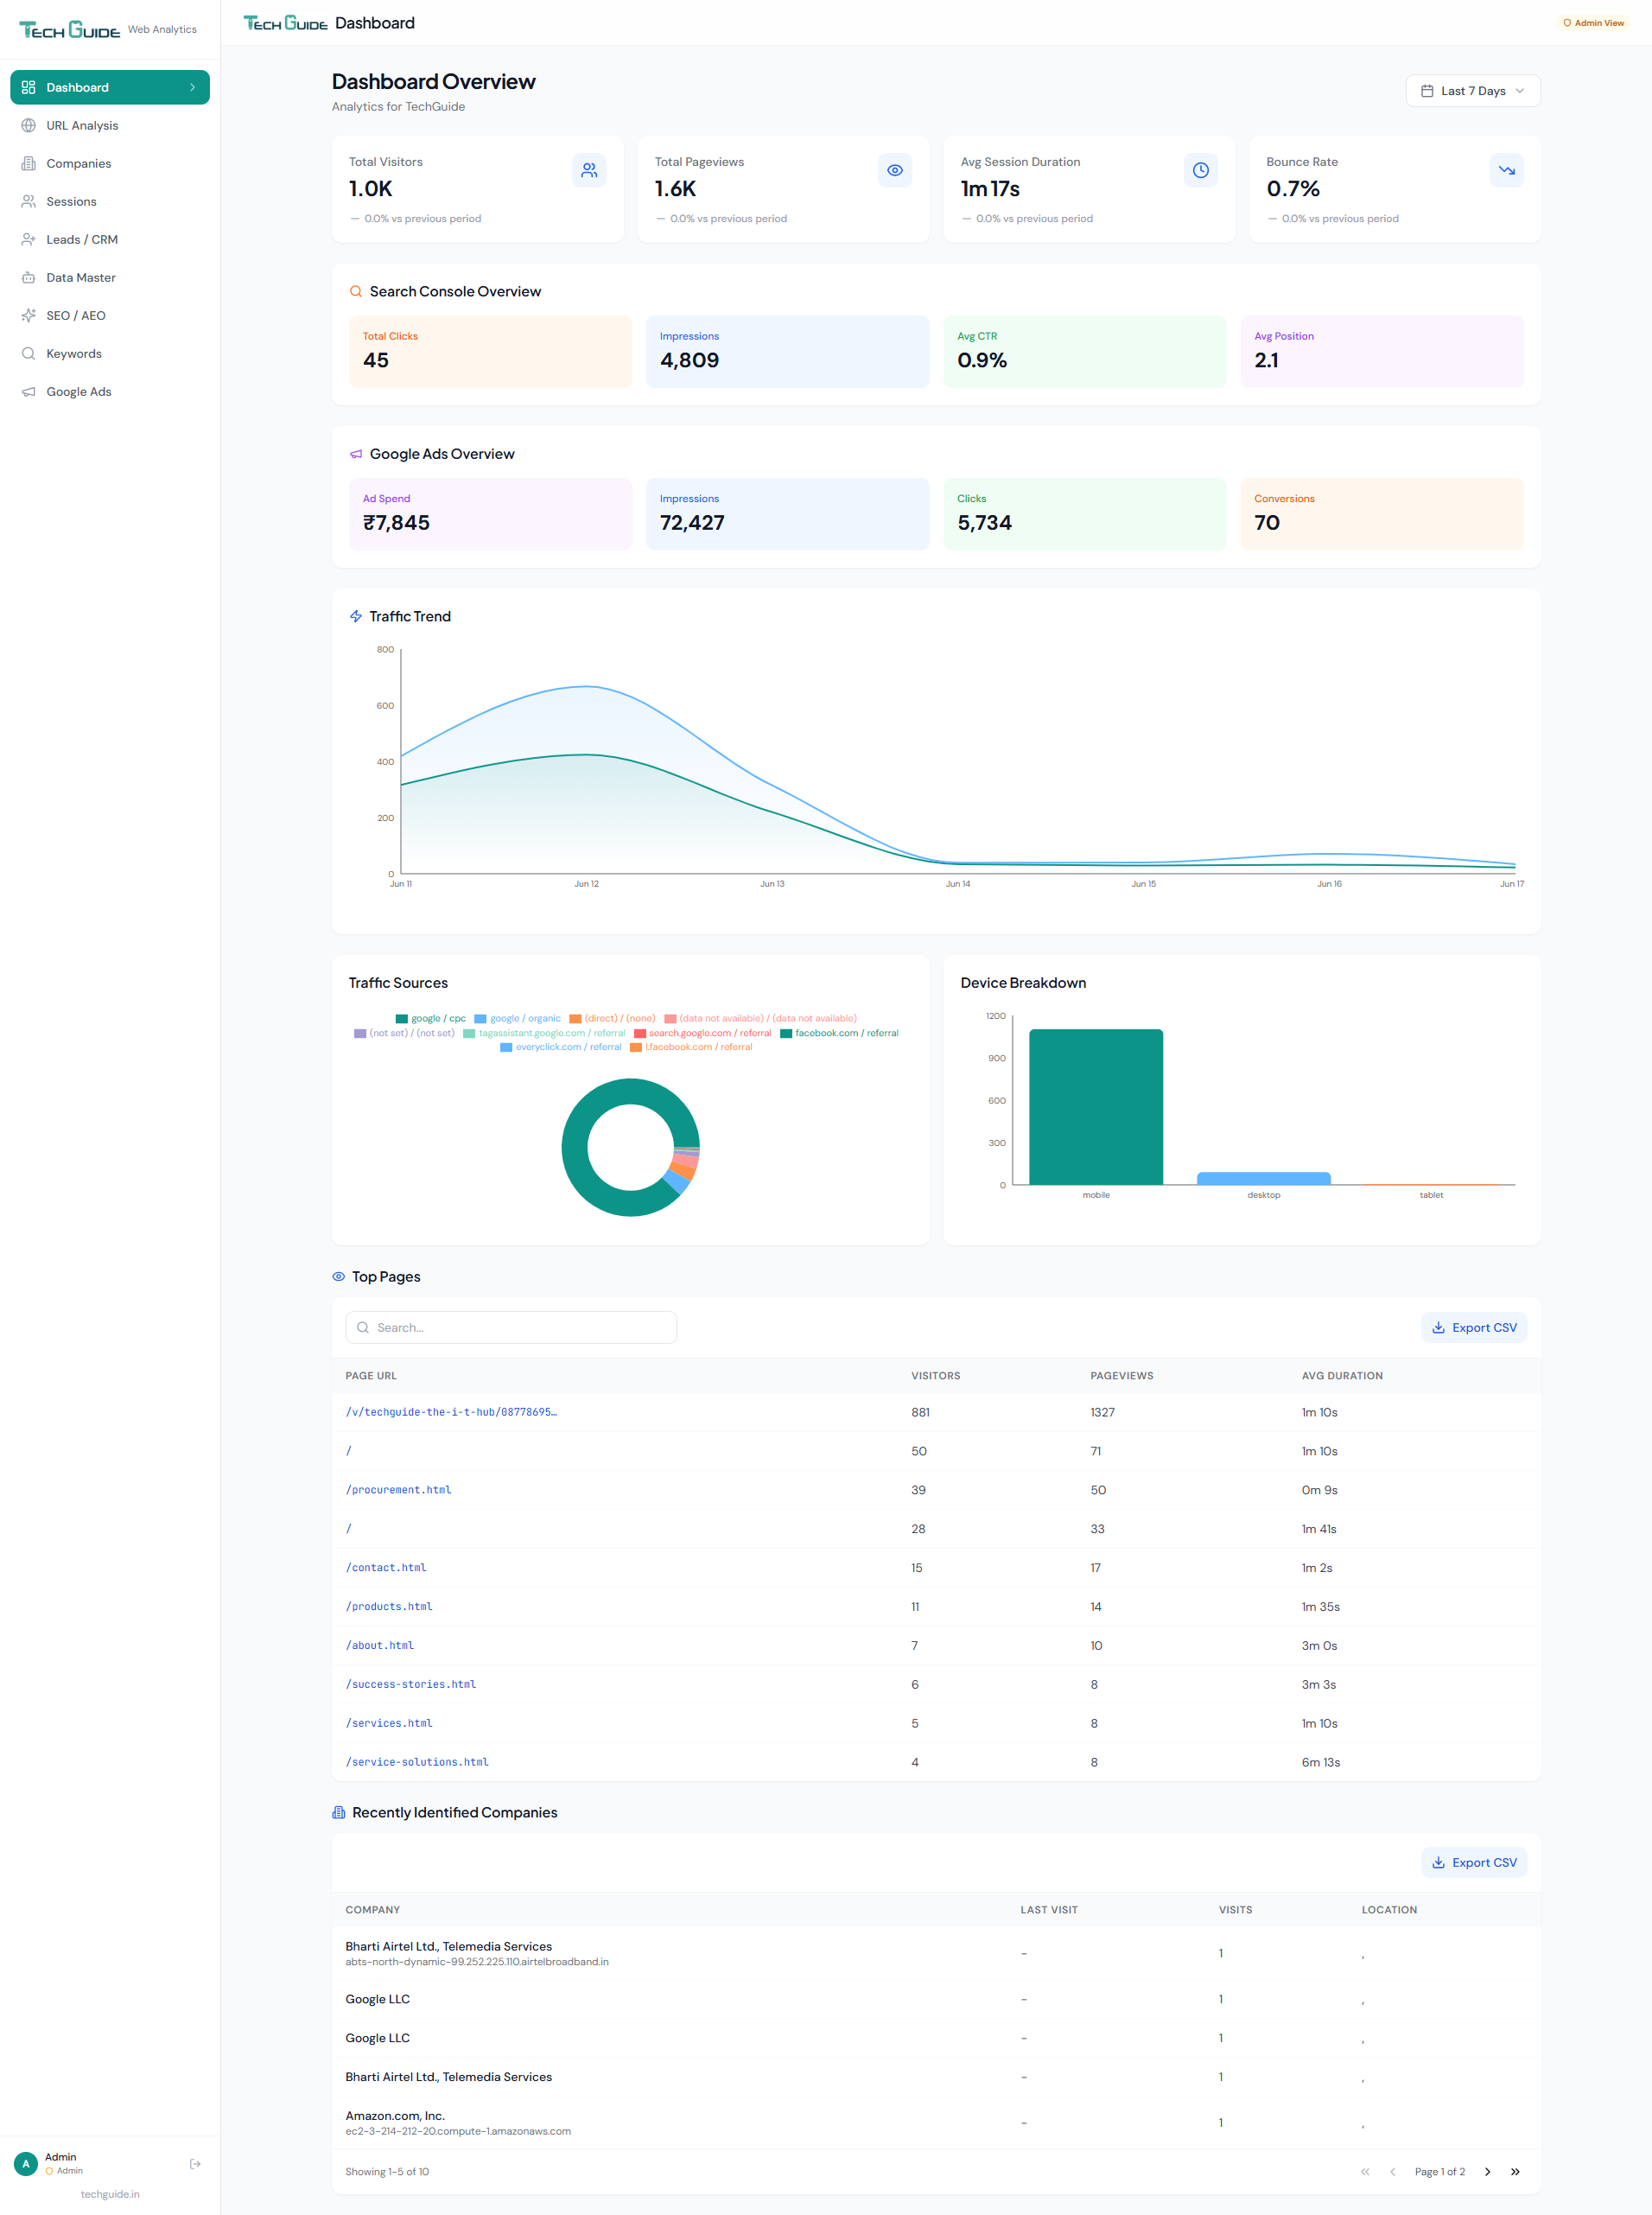
Dashboard Overview
Your entire online performance at a glance — traffic, search console, Google Ads, top pages, and identified companies, all on one screen.
- See total visitors, pageviews, session duration, and bounce rate in real time
- Search Console overview with clicks, impressions, CTR, and average position
- Google Ads spend, impressions, clicks, and conversions summary
- Interactive traffic trend chart with daily breakdowns
- Traffic sources pie chart and device breakdown
- Top pages ranked by visitors with duration insights
- Recently identified companies visiting your website
Screenshot 2 of 11
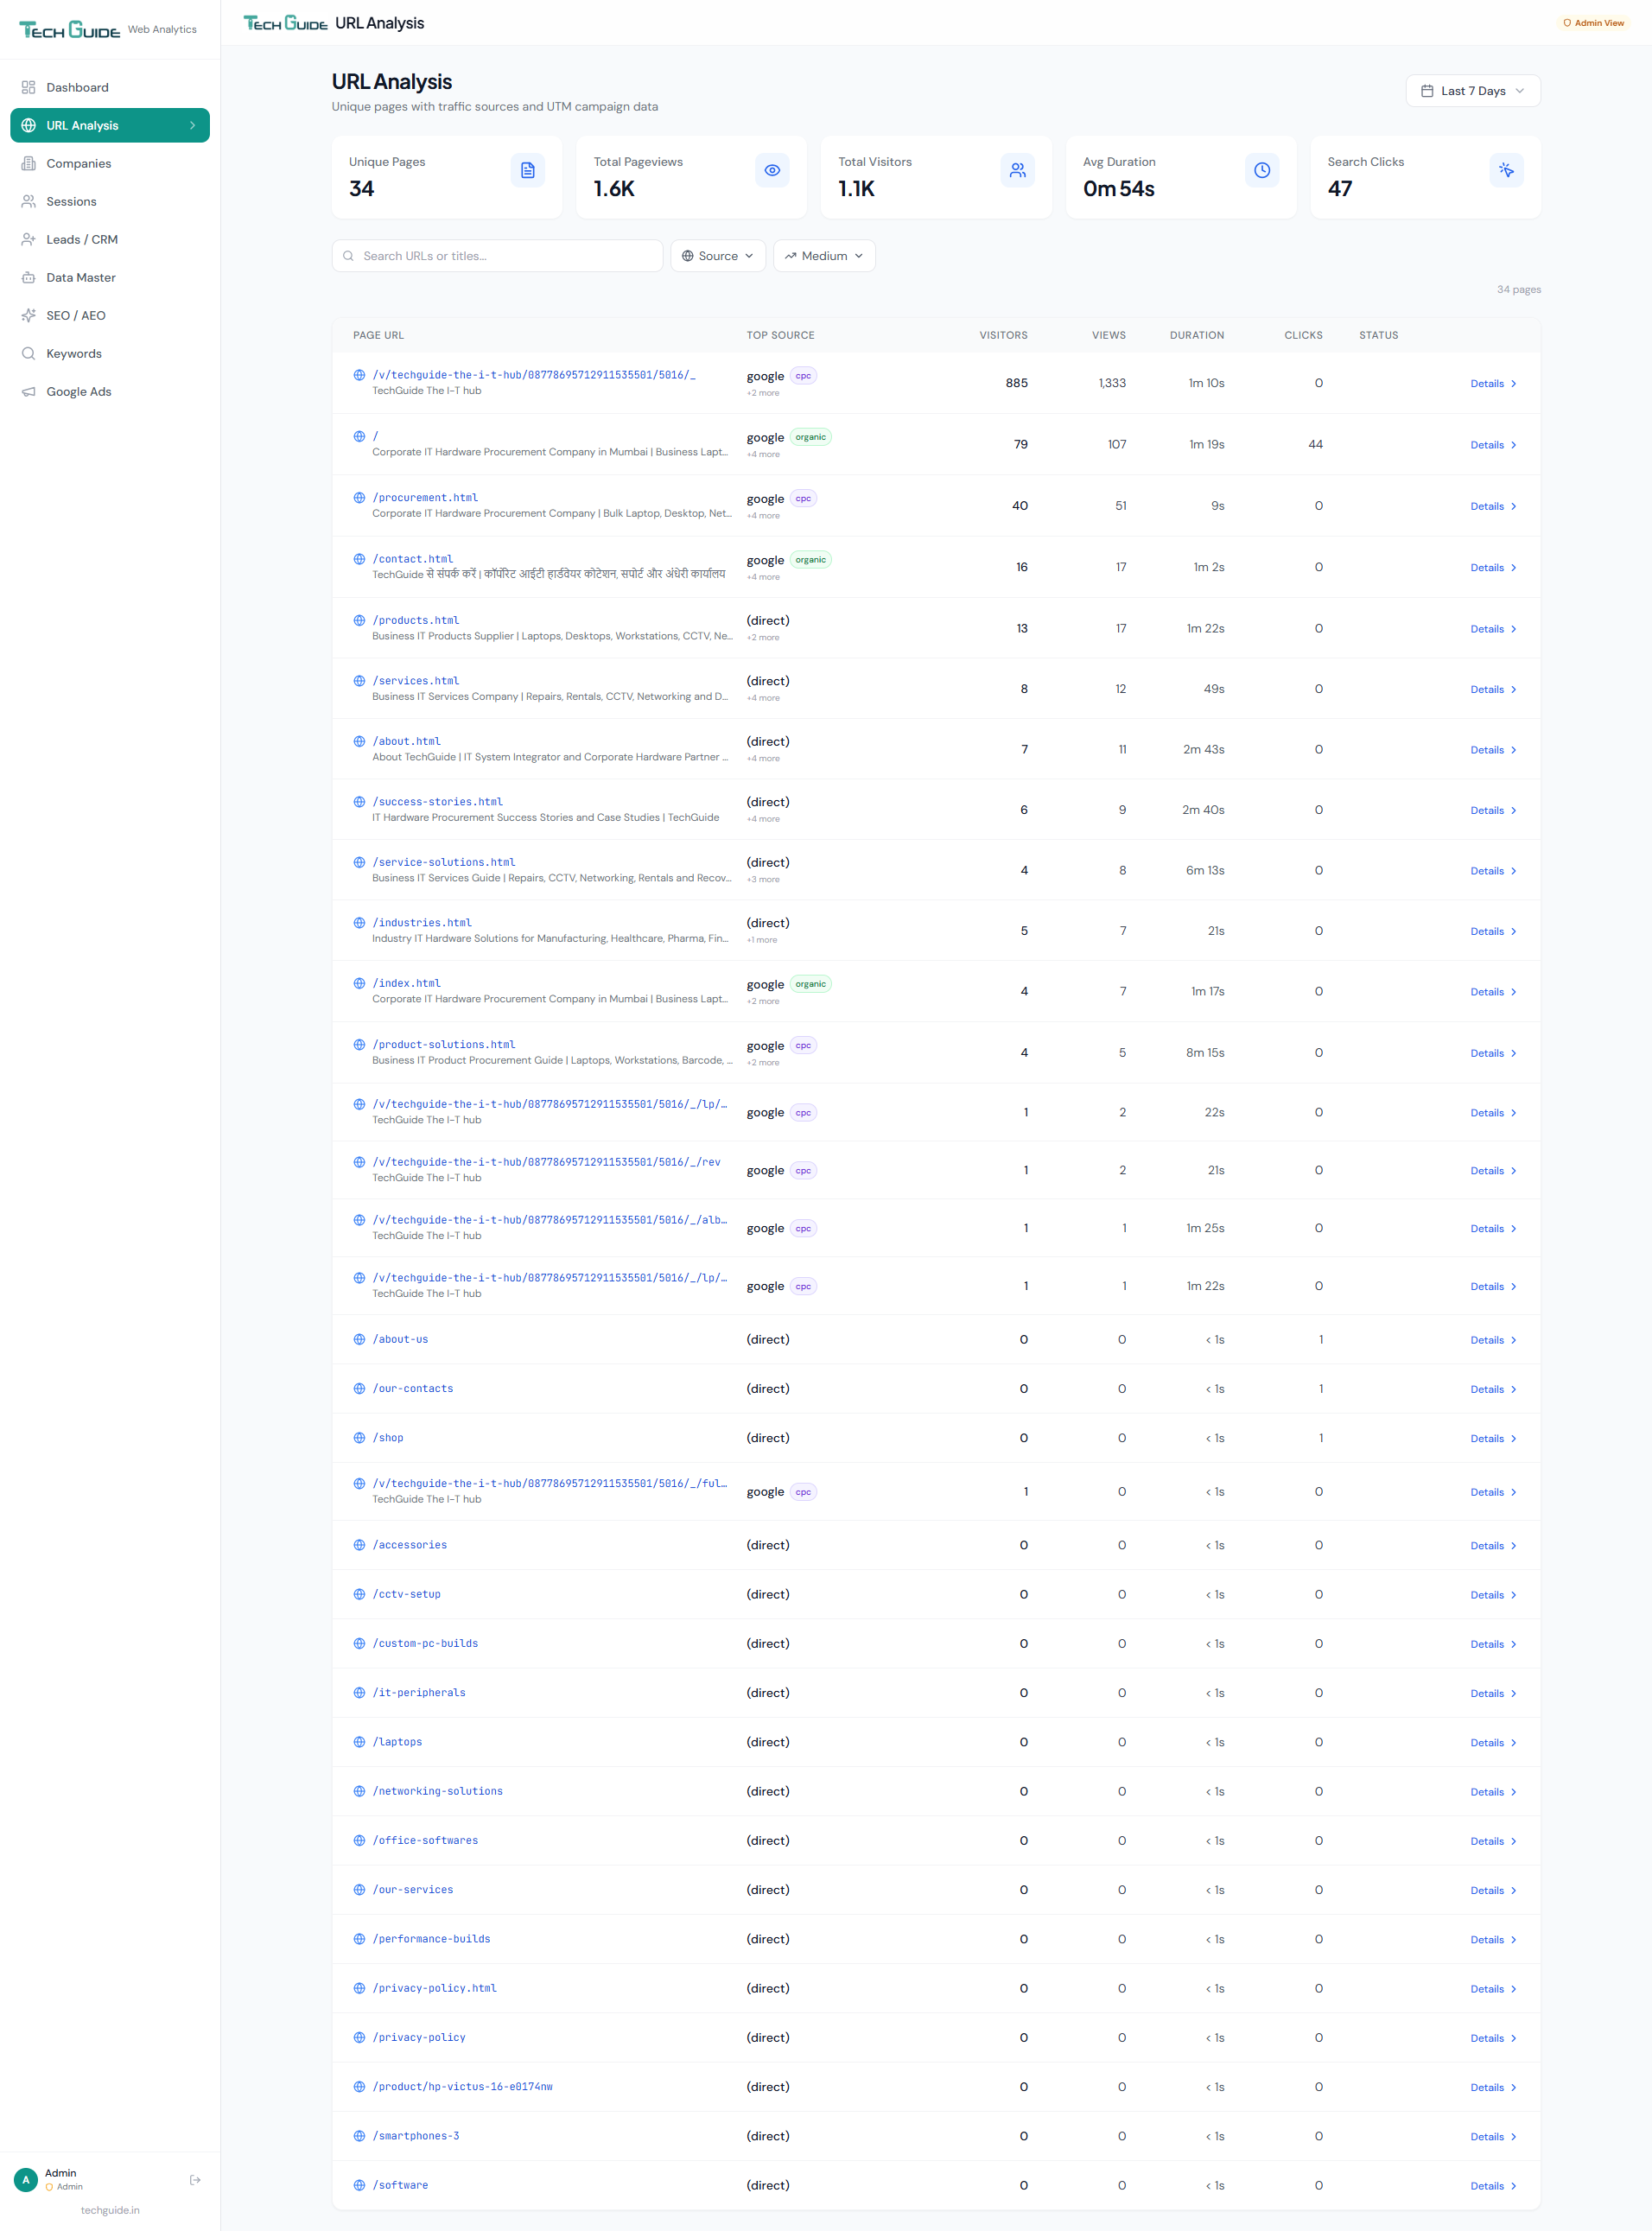
URL Analysis — Pages Overview
Know exactly how every page on your website performs — from homepage to product pages. See which pages attract visitors and which need attention.
- Every unique URL tracked with visitor counts, pageviews, and session duration
- Top traffic source shown for each page (organic, CPC, direct, referral)
- Search Console clicks mapped to each URL for SEO insights
- Filter pages by source or medium to isolate campaign performance
- Quickly spot orphan pages not linked from your sitemap
Screenshot 3 of 11
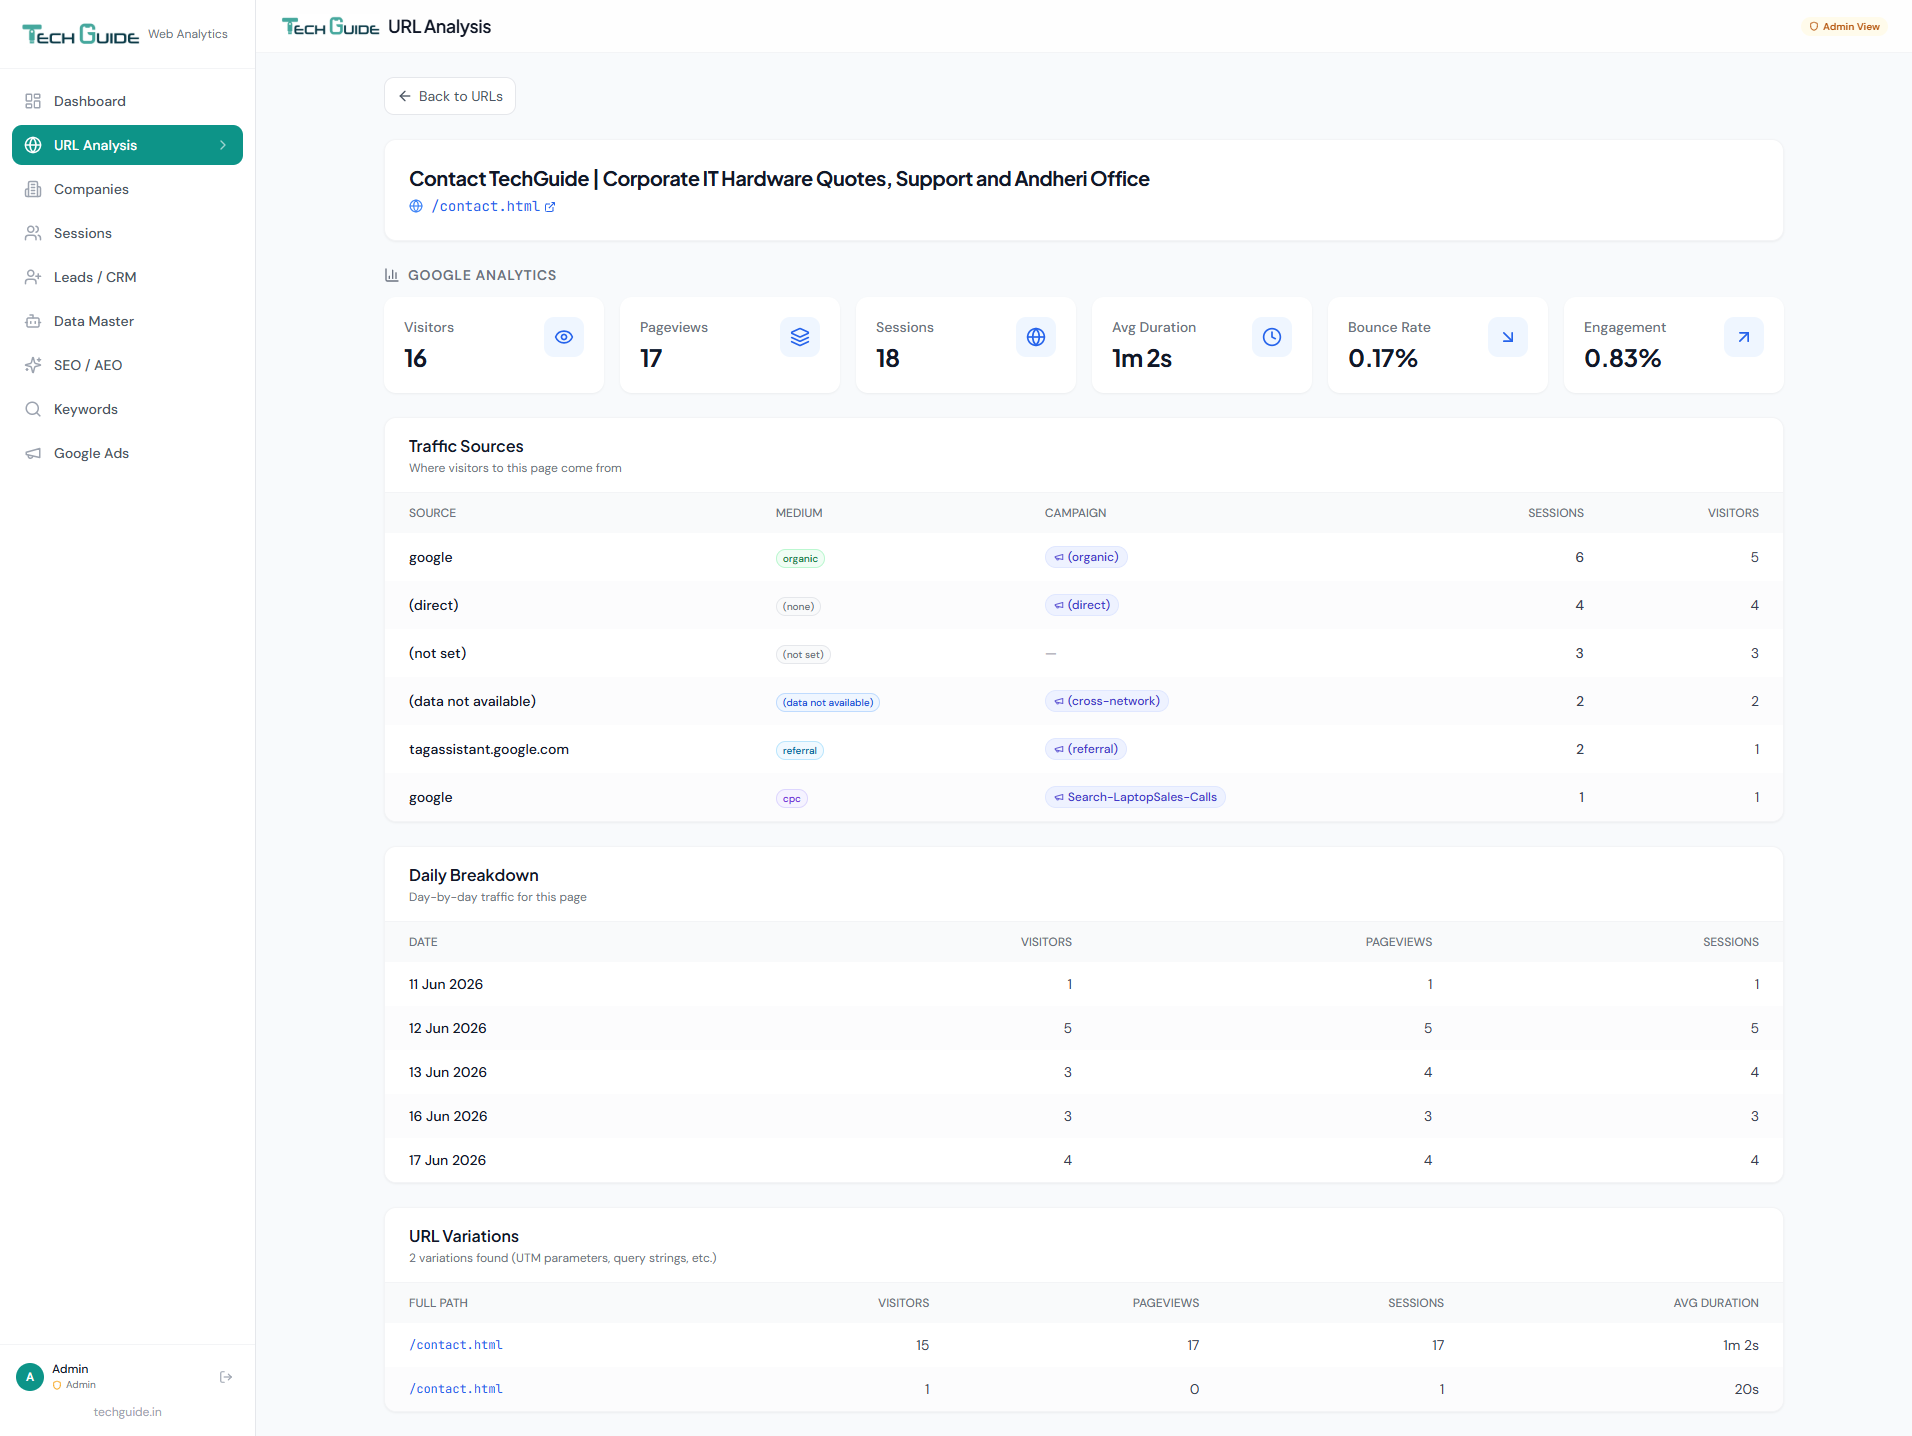
URL Analysis — Page-Level Deep Dive
Click any page to see the full story — who visited, where they came from, how traffic changes day by day, and which URL variations exist.
- Google Analytics metrics: visitors, pageviews, sessions, avg duration, bounce rate, engagement
- Traffic source breakdown showing source, medium, campaign, sessions, and visitors
- Day-by-day traffic trend for the selected period
- URL variations analysis (query strings, UTM parameters) with individual stats
Screenshot 4 of 11
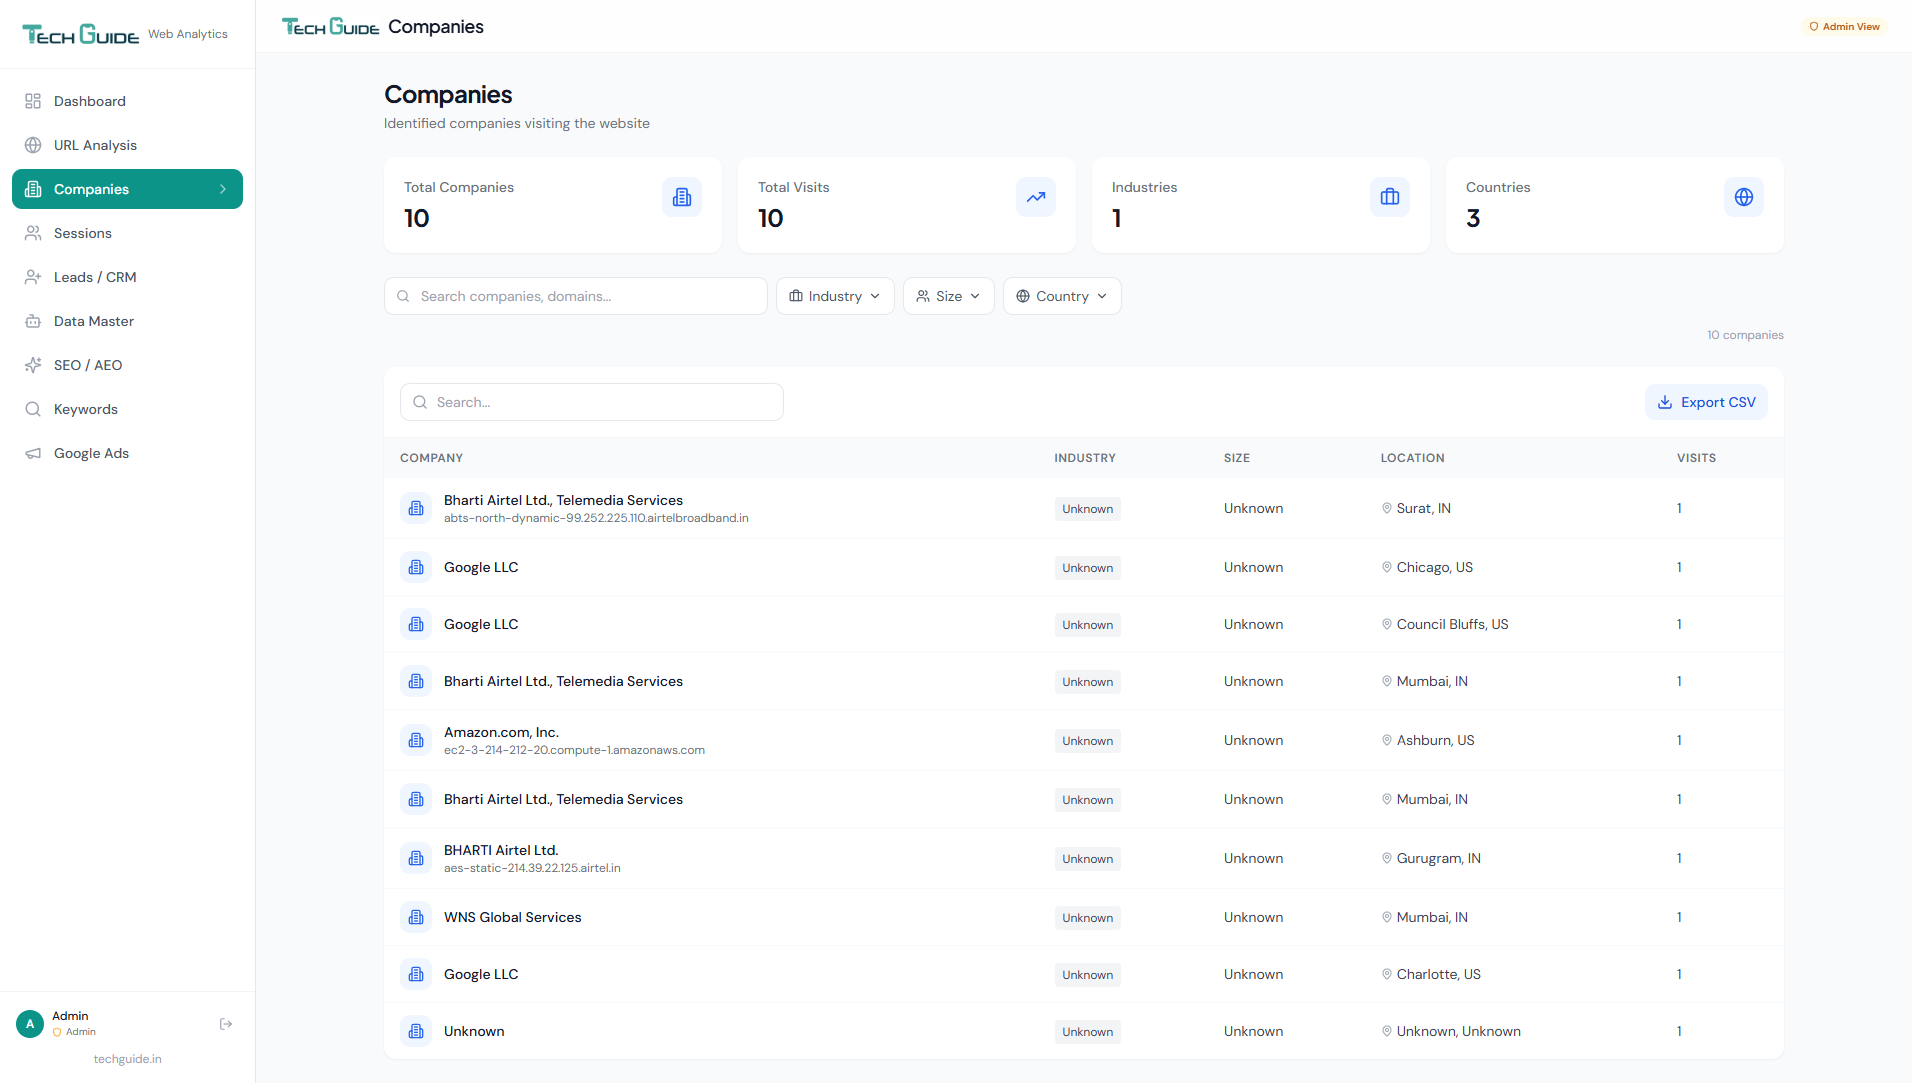
B2B Company Identification
Turn anonymous website traffic into named B2B leads. See which companies are browsing your site, what they viewed, and how often they return.
- Automatic company name detection from IP intelligence
- Industry classification and company size estimation
- Visit frequency and total page view tracking per company
- Geographic location mapping for each identified visitor
- Export identified companies to CSV for CRM import
Screenshot 5 of 11
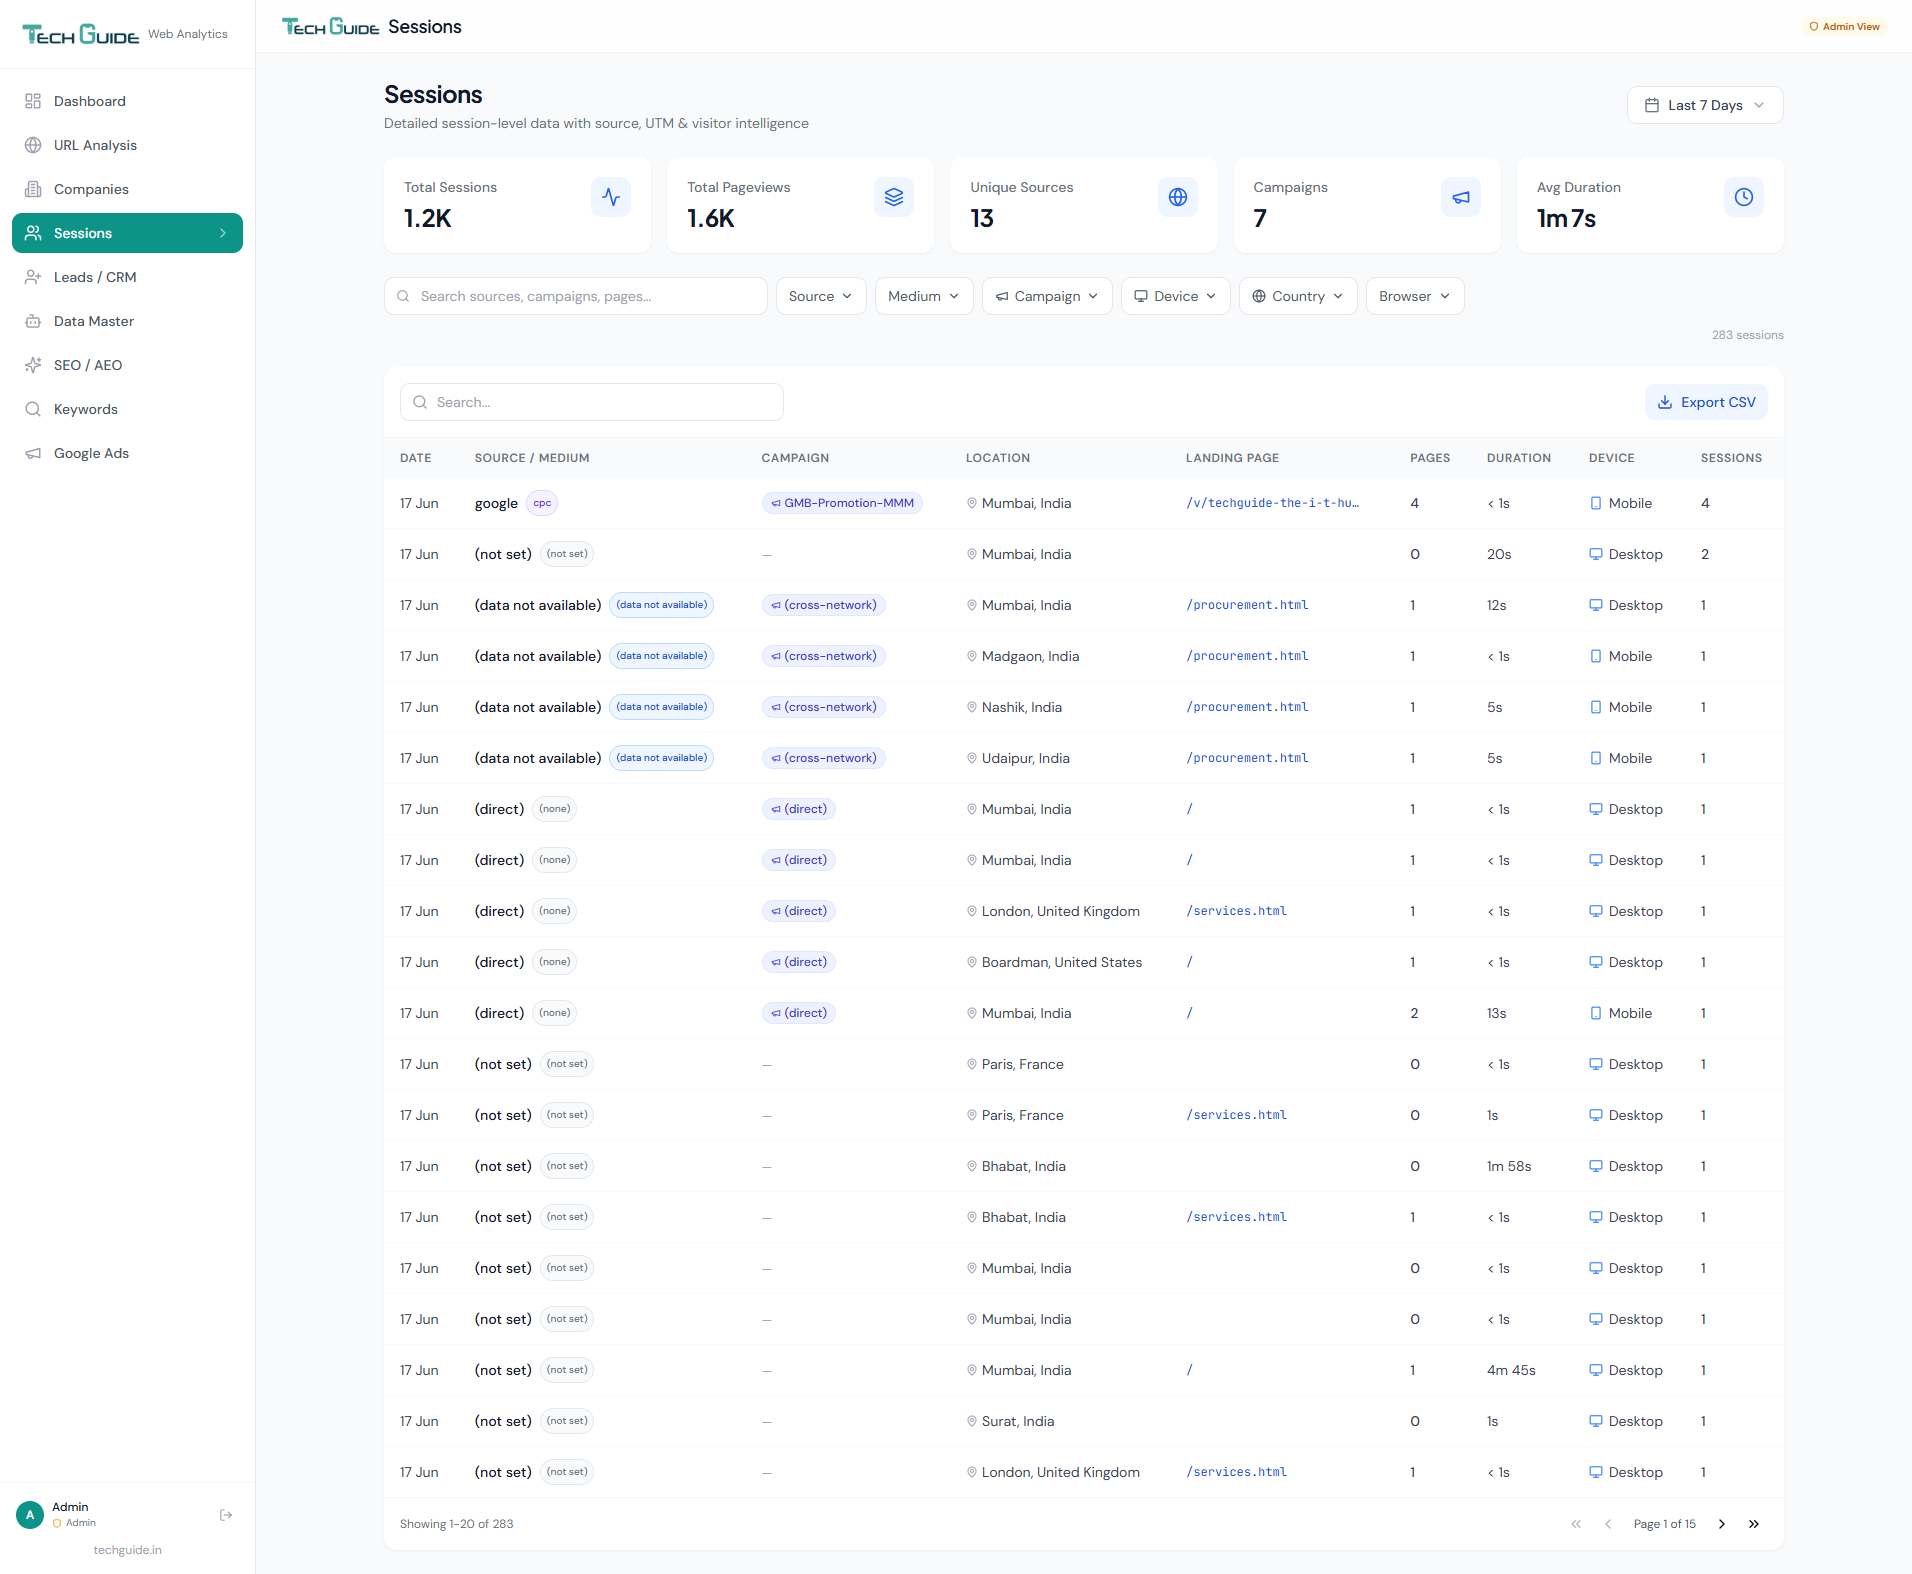
Session Explorer
Drill into every individual session on your website. Filter by source, device, campaign, country, browser — and see the complete visitor journey.
- Detailed session-level data with source, medium, and campaign attribution
- Geographic location (city & country) for every session
- Landing page, pages viewed, duration, and device type
- Filter by any dimension: source, medium, campaign, device, country, browser
- Paginated view handling thousands of sessions effortlessly
- Export session data to CSV for deeper analysis
Screenshot 6 of 11
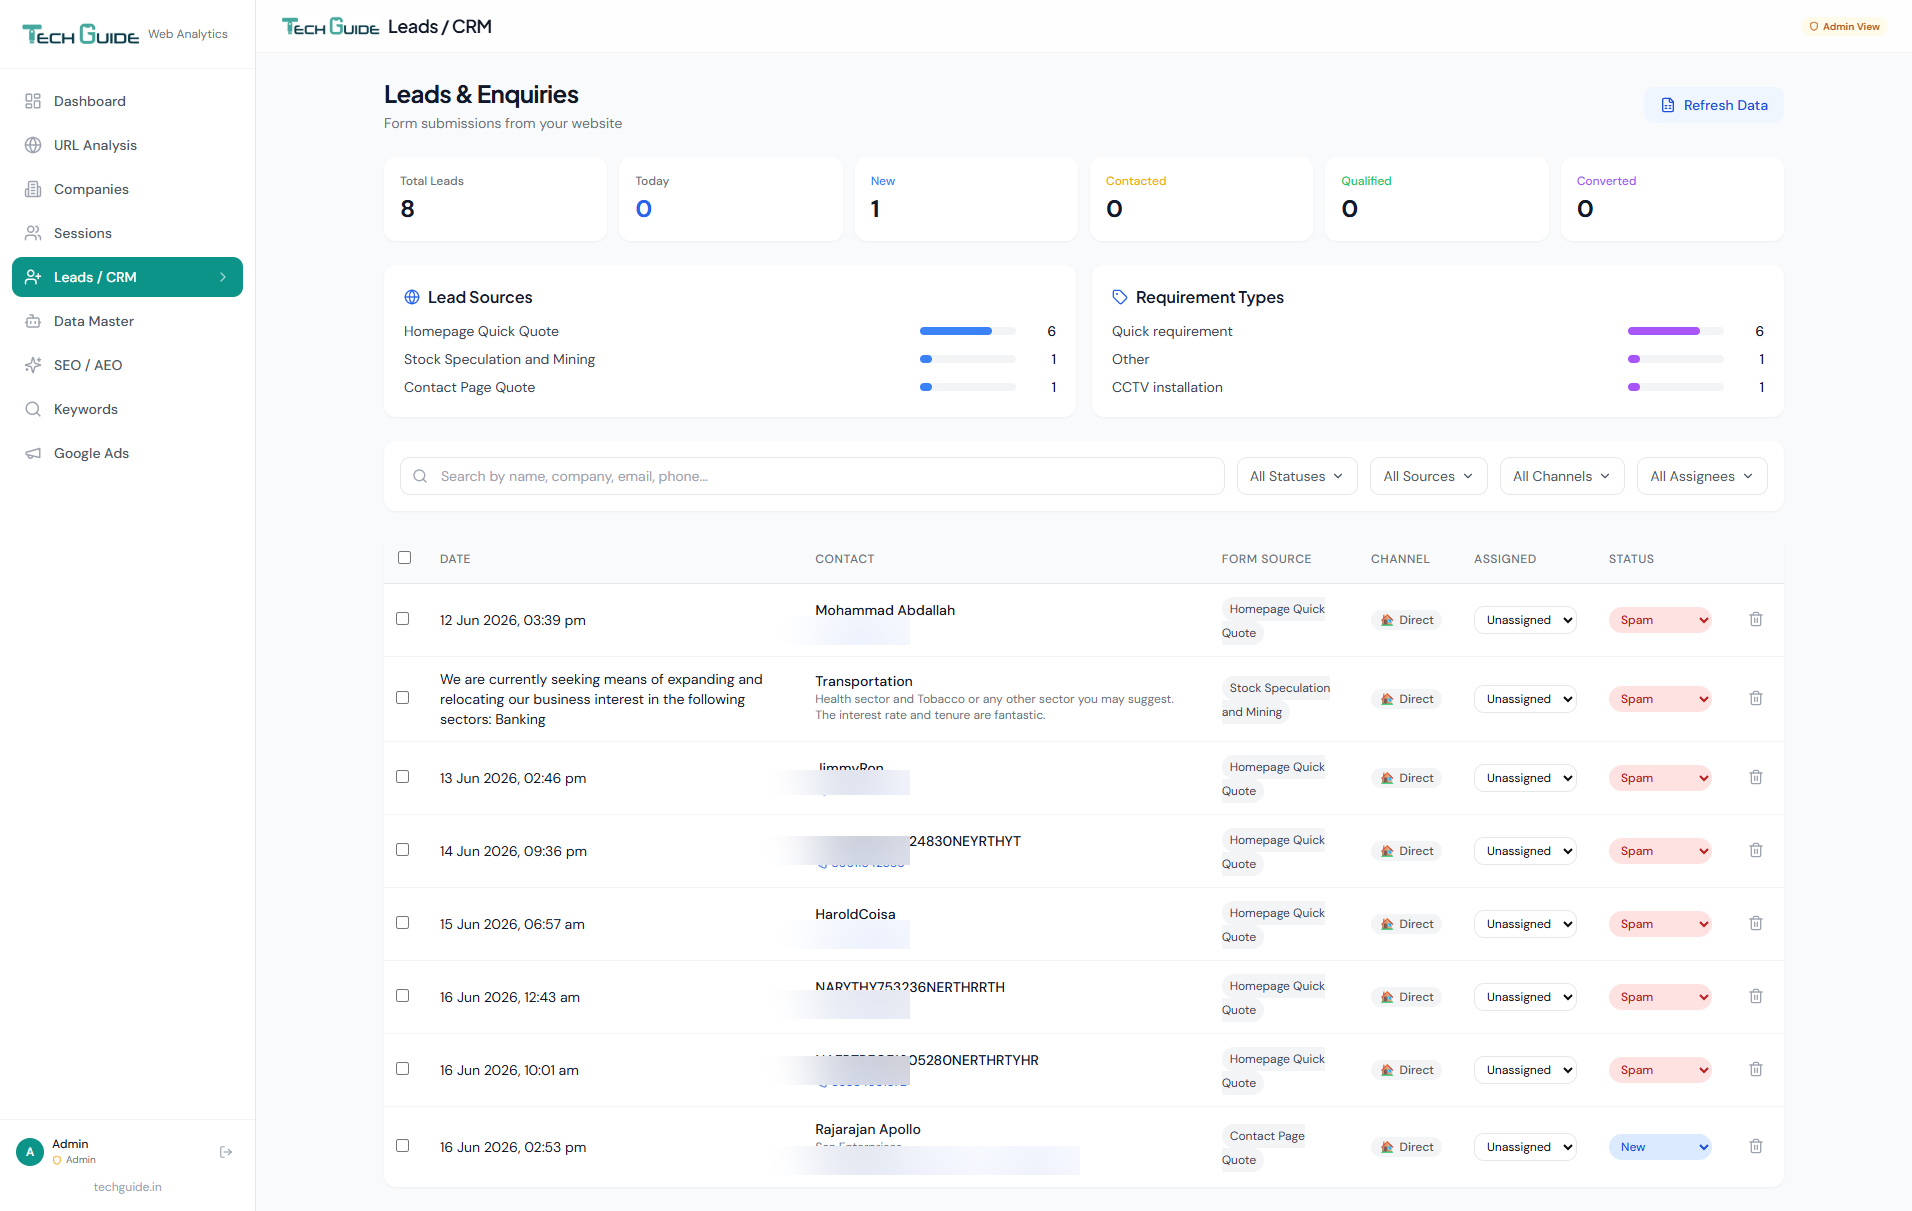
Leads & CRM
Every form submission captured, categorised, and ready for follow-up. Manage lead status, assign team members, filter by source — all in one place.
- All website form submissions auto-captured (contact forms, quote requests, enquiries)
- Lead source and requirement type breakdown at a glance
- Status management: New, Contacted, Qualified, Converted, Spam
- Assign leads to team members with dropdown selectors
- Filter by status, source, channel, and assignee
- Search across names, companies, emails, and phone numbers
Screenshot 7 of 11
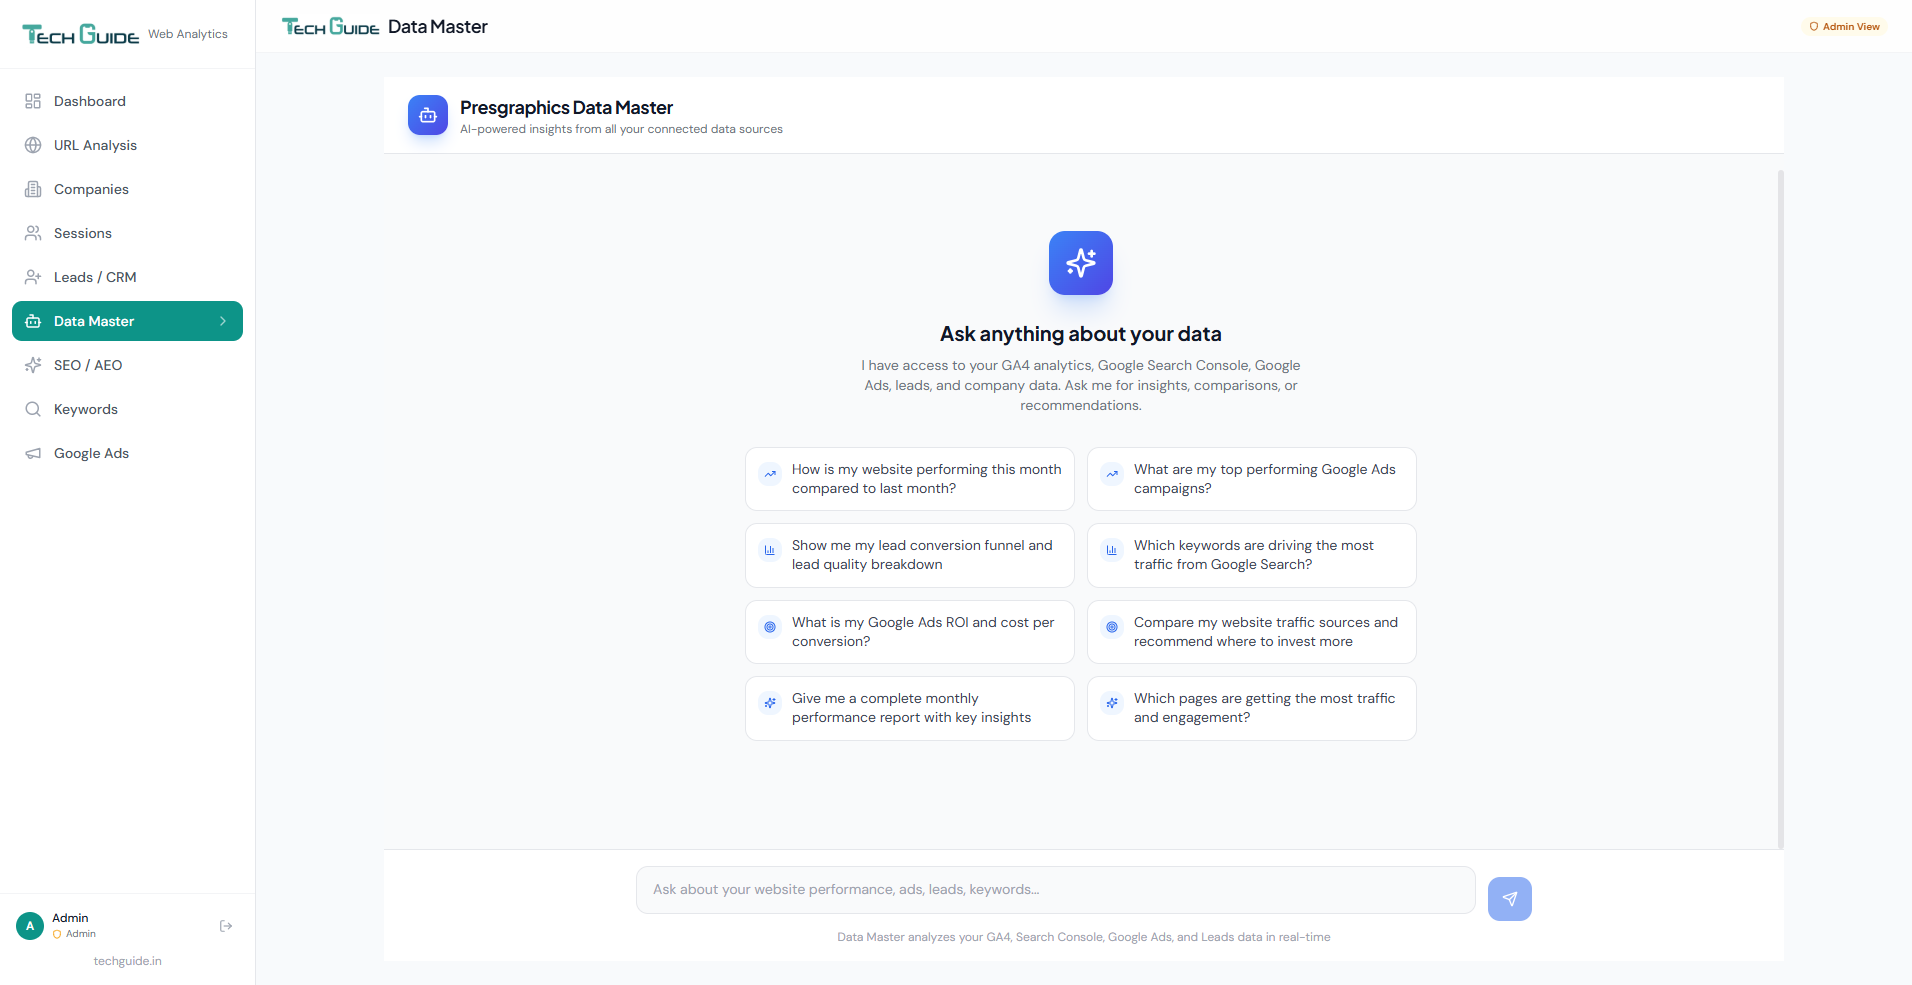
AI Data Master
Ask questions about your website data in plain English. The AI analyses your GA4, Search Console, Google Ads, and lead data to deliver instant insights.
- Natural language queries — no SQL or data skills needed
- Cross-platform analysis across GA4, Search Console, Ads, and CRM data
- Pre-built prompt suggestions for common business questions
- Get performance comparisons, trend explanations, and actionable recommendations
- Generate monthly reports and identify growth opportunities instantly
Screenshot 8 of 11
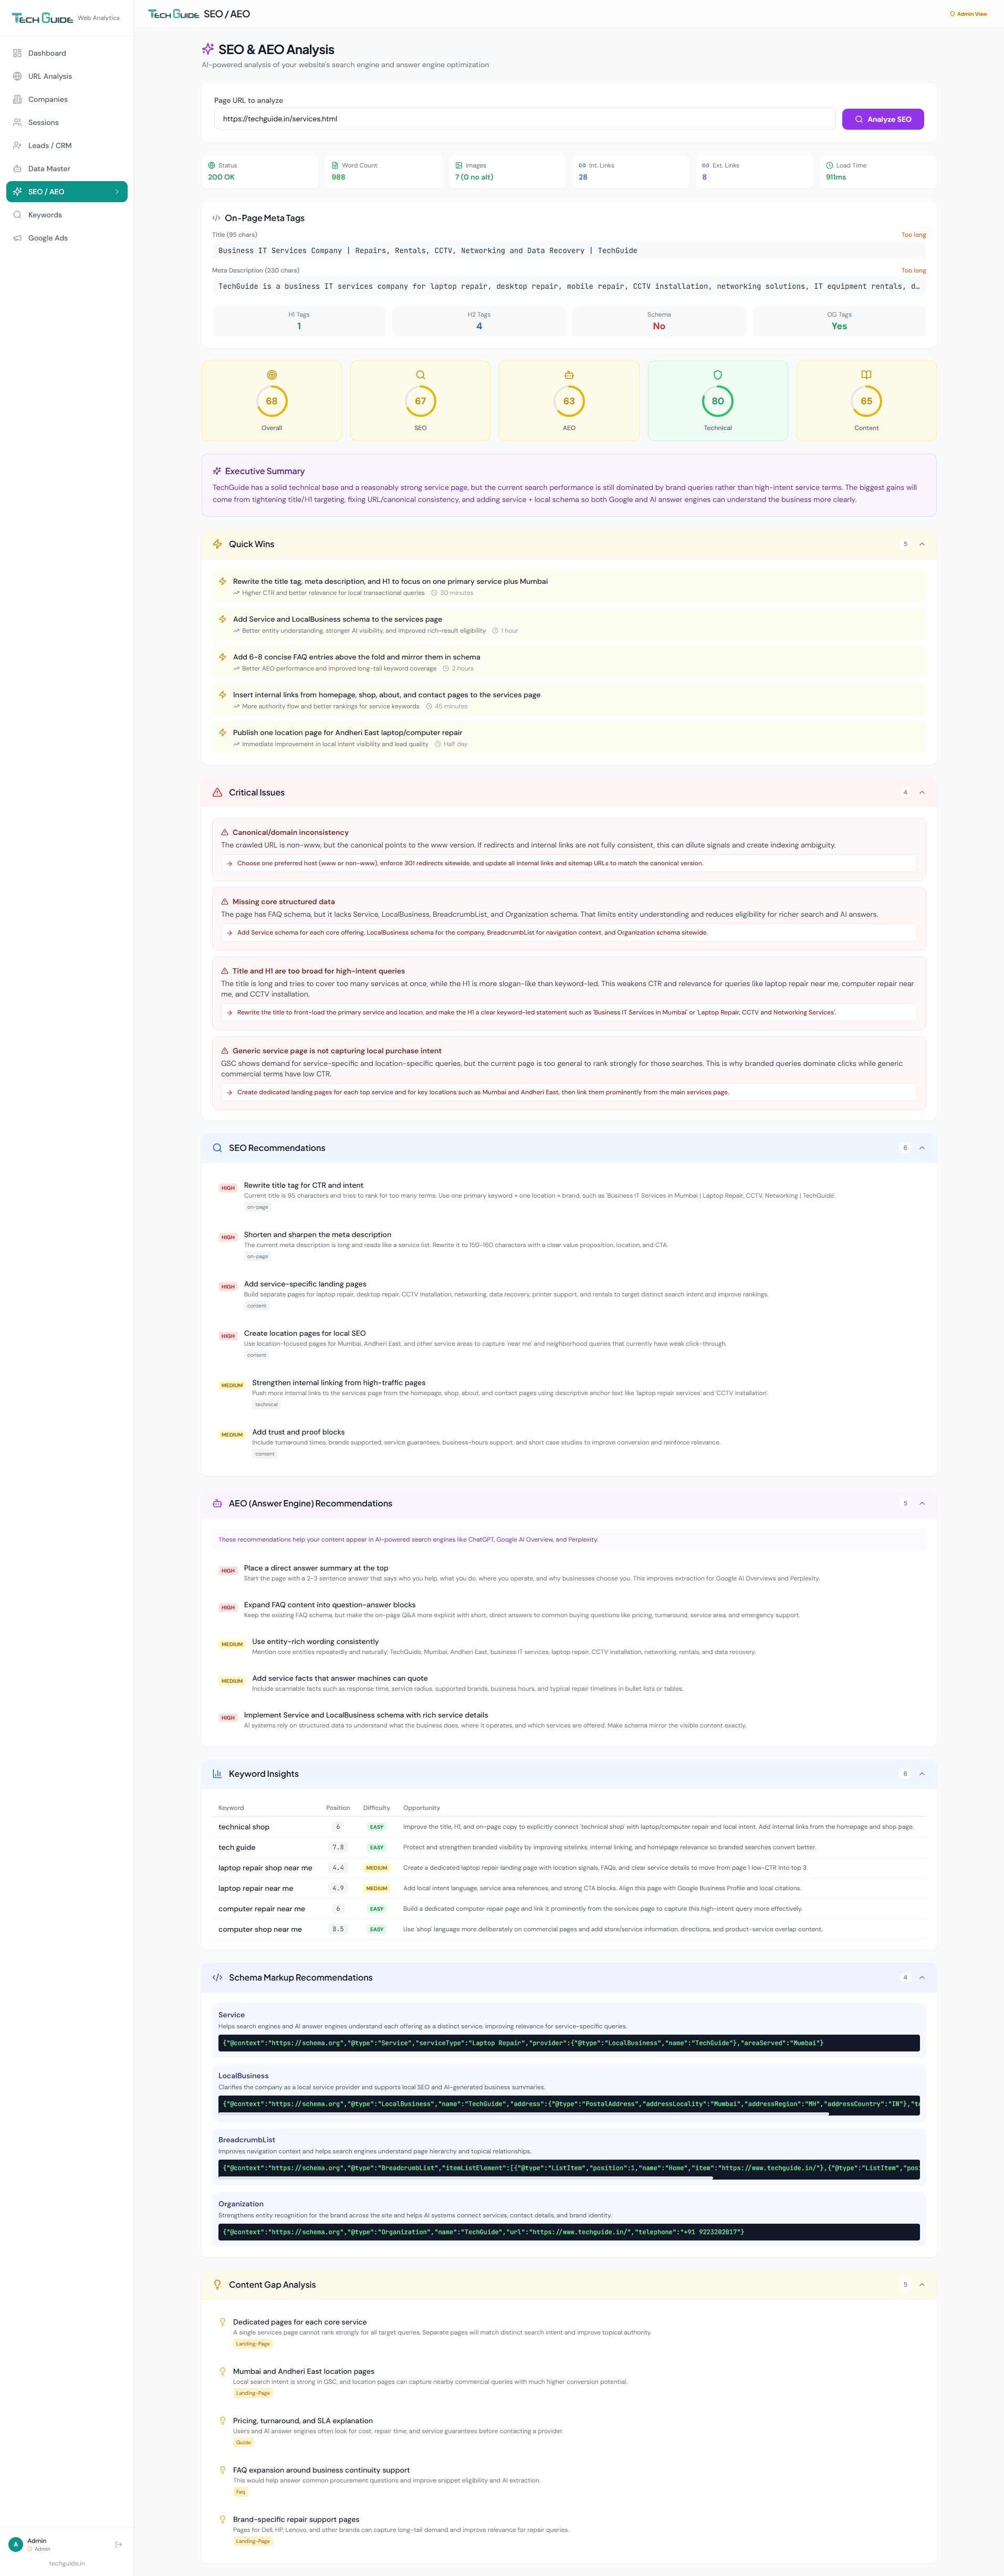
SEO & AEO Analysis
AI-powered page-level SEO audits with Answer Engine Optimisation insights. Get a score, critical issues, quick wins, and step-by-step recommendations.
- Overall SEO score (0–100) with AEO readiness assessment
- On-page meta tags analysis with word count and image stats
- Critical issues flagged with priority fixes (canonical, schema, structure)
- Quick wins you can implement today for immediate ranking improvement
- Detailed SEO & AEO recommendations with expandable guidance
- Keyword insights table with difficulty scores and opportunities
- Schema markup recommendations (Service, LocalBusiness, FAQ, Organisation)
- Content gap analysis suggesting new pages to create
Screenshot 9 of 11
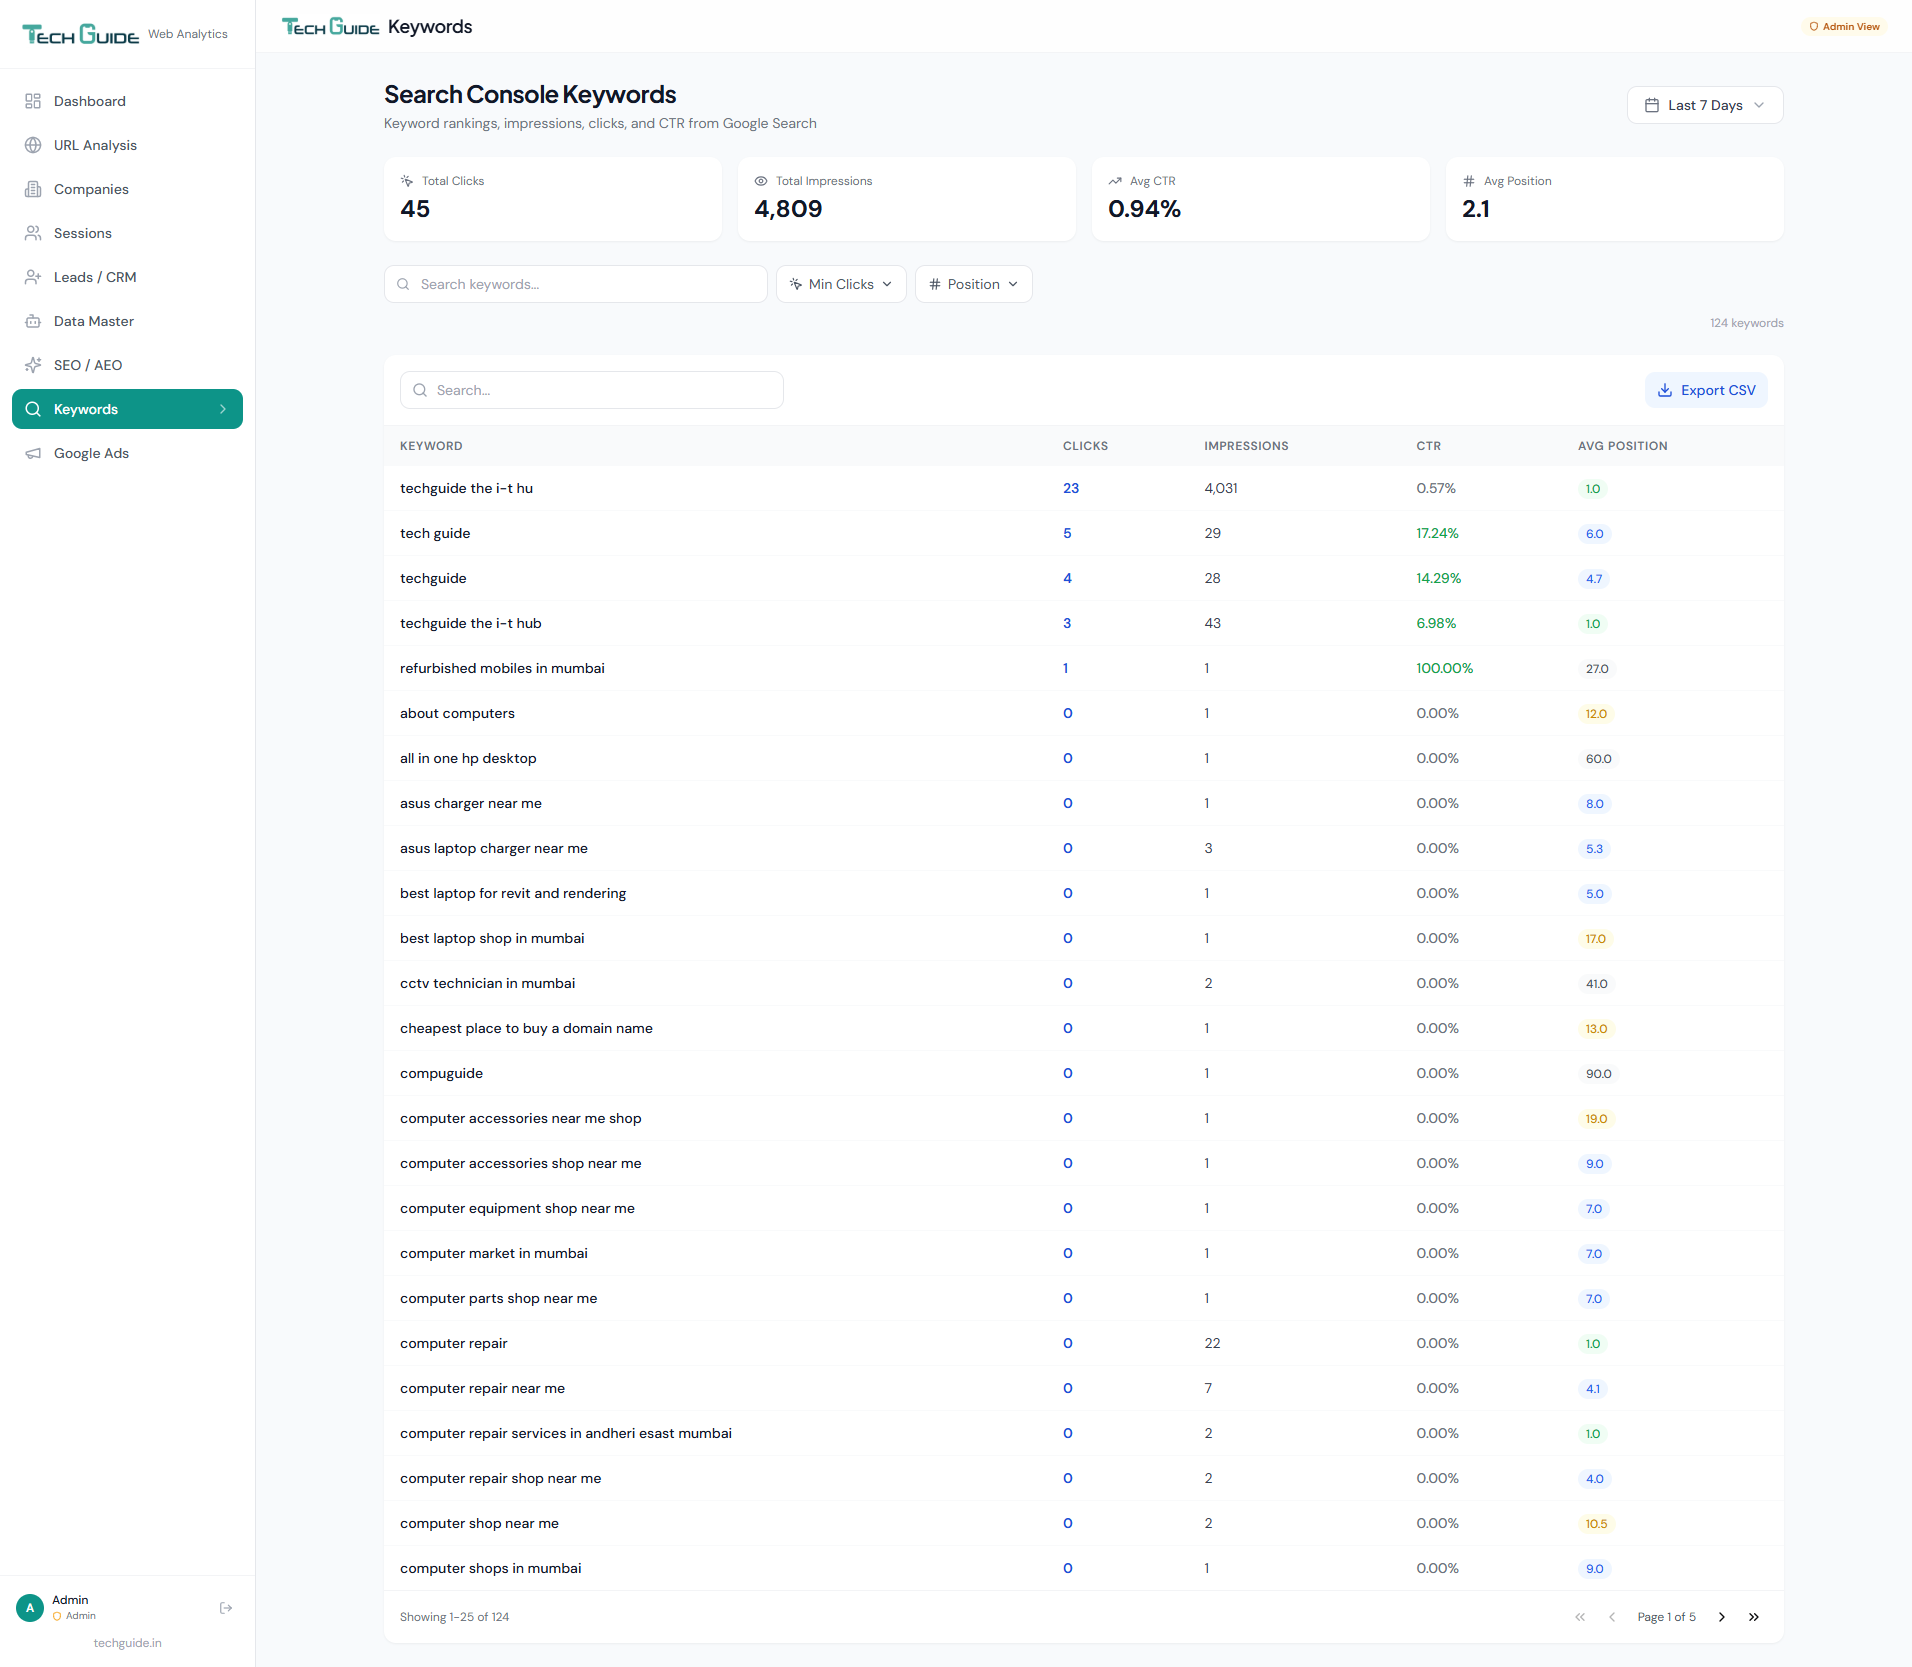
Search Console Keywords
See every keyword driving traffic from Google Search — with clicks, impressions, CTR, and average position. Spot opportunities and track rankings over time.
- Full keyword list from Google Search Console with performance metrics
- Click and impression data for every search term
- CTR and average position tracking to monitor ranking changes
- Filter by minimum clicks or position range to focus on what matters
- Search across all keywords to find specific terms instantly
- Export keyword data to CSV for reporting
Screenshot 10 of 11
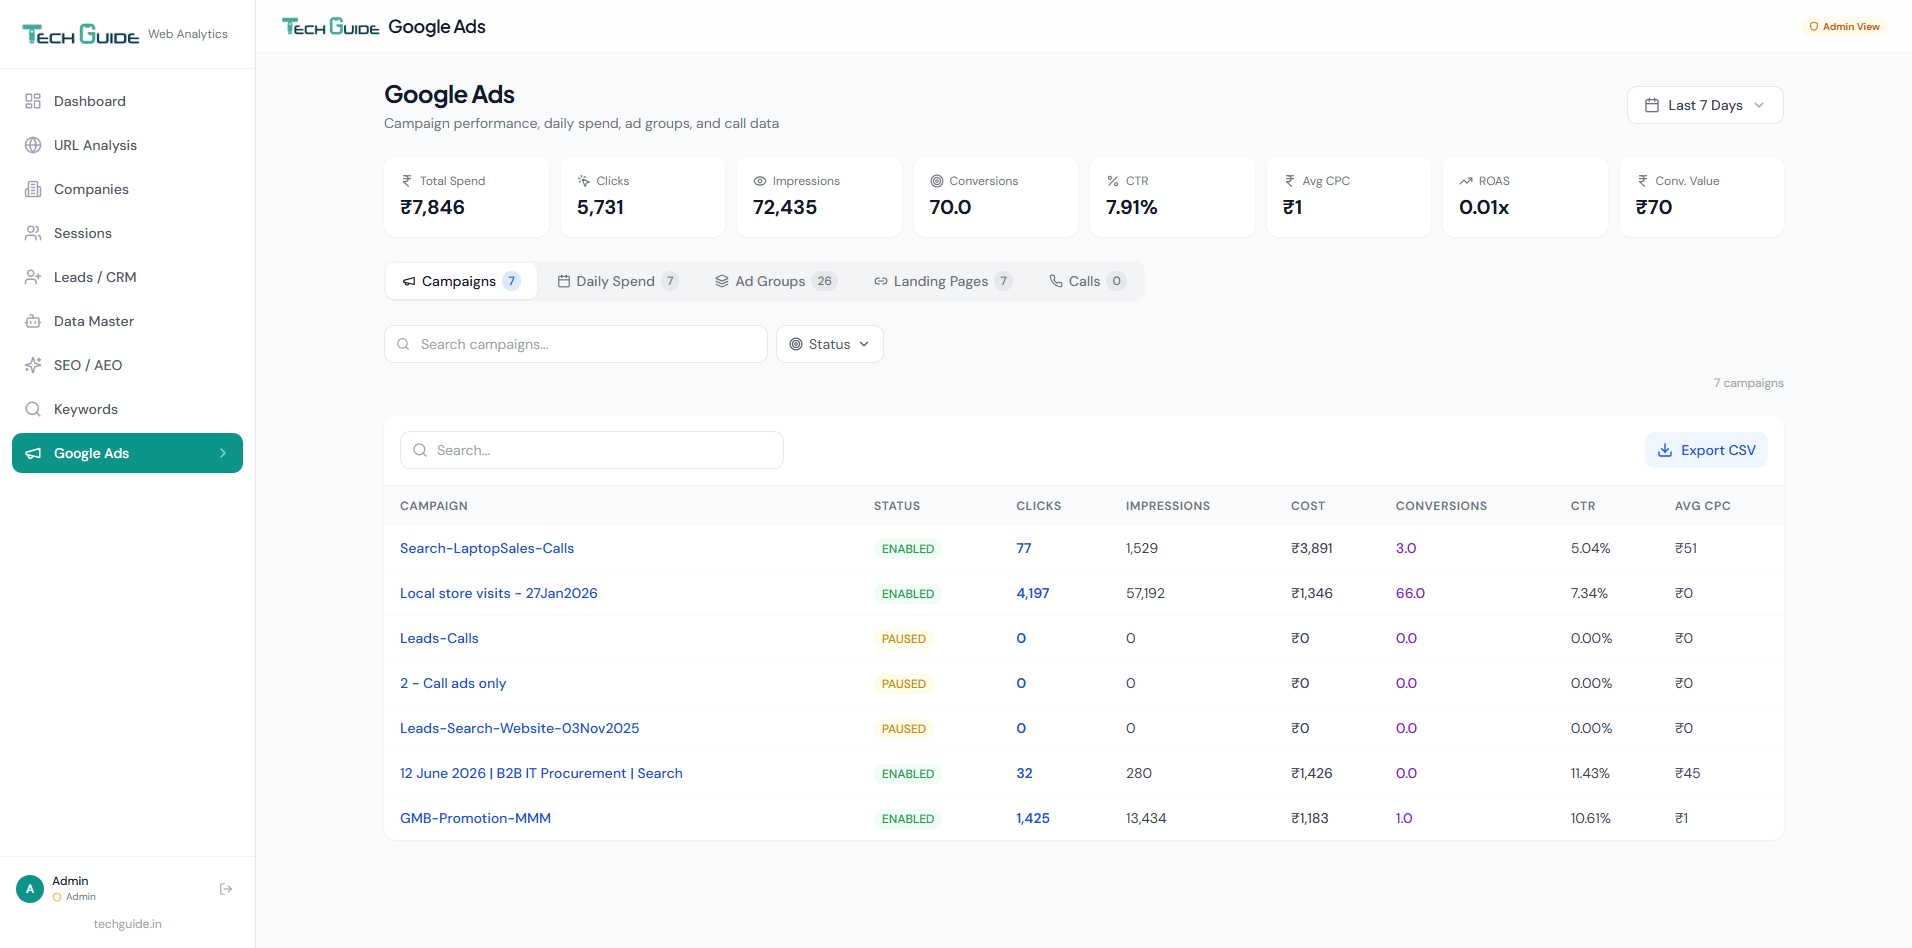
Google Ads — Campaign Overview
See all your Google Ads campaigns in one dashboard — spend, clicks, impressions, conversions, CTR, CPC, and ROAS. Filter by status and drill into any campaign.
- Total spend, clicks, impressions, conversions, CTR, avg CPC, and ROAS at the top
- Tab navigation: Campaigns, Daily Spend, Ad Groups, Landing Pages, Calls
- Campaign-level table with status badges (Enabled, Paused)
- Click any campaign to drill into ad groups and daily spend
- Multi-account support — aggregate data from multiple Google Ads accounts
- Export campaign data to CSV
Screenshot 11 of 11
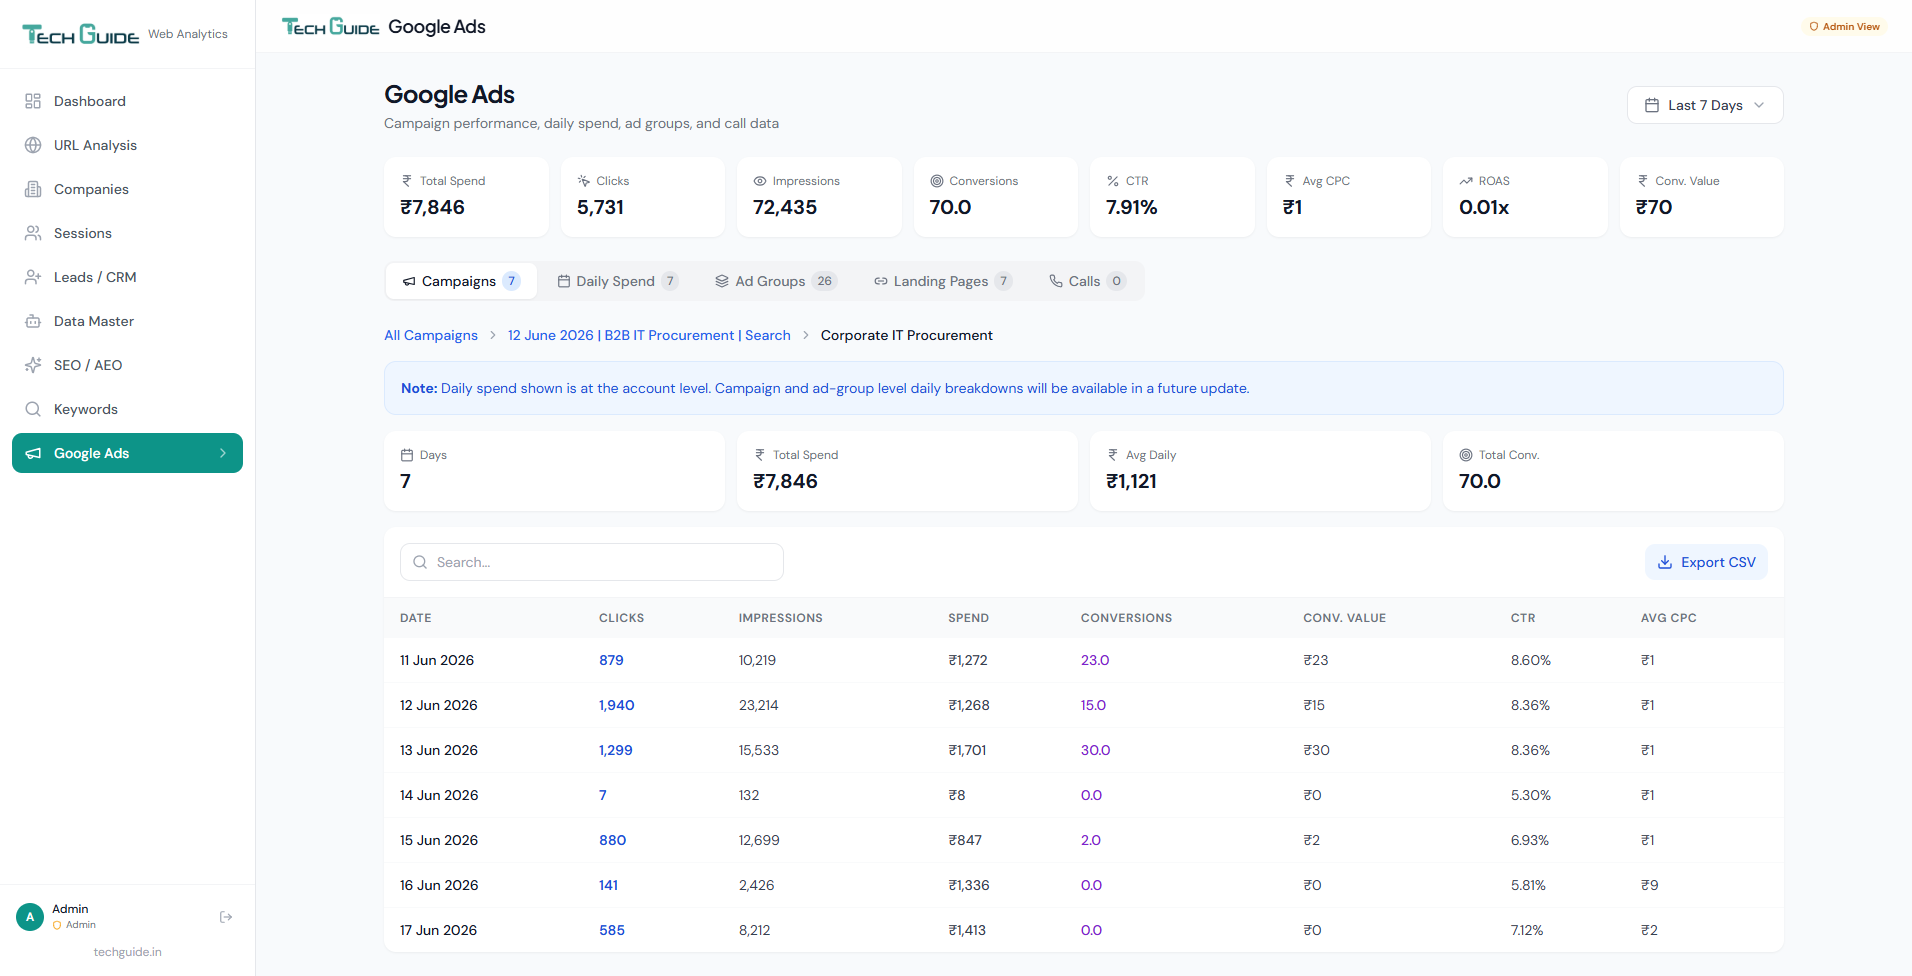
Google Ads — Daily Spend Breakdown
Track your Google Ads spending day by day. See exactly where your budget goes, which days perform best, and when conversions happen.
- Day-by-day breakdown of clicks, impressions, spend, conversions, and CPC
- Conversion value tracking to calculate true ROI
- Drill-down breadcrumb navigation: All Campaigns → Campaign → Ad Group
- Summary cards showing total days, spend, average daily cost, and total conversions
- Identify high-spend low-conversion days to optimise budget allocation
Ready to See This for Your Website?
Your personalised analytics dashboard — with all these features and your real data — will be ready within 24 hours. All for just ₹900/month.